A Workshop sponsored by the National Science Foundation to inform future Computer Science curriculum changes
I worked on this project with another undergrad in Purdue UX, Camile Hardt, and we both worked under professor Colin Gray. We worked with other academics as well, who acted as facilitators during the 2-Day workshop, which included over 50 participants from Junior and Senior practitioner roles, Executives, and Academics from across the country.
Workshop Goals
The goal of this workshop to look at how people at different levels of the computing industry view their past academic experience, how it might have prepared them for their careers, and where it fell short. It specifically aimed for the collision of ideas and values between these groups, to see how being in a different level or area of the industry can effect one’s views on the curriculum. The difference between the views that Junior Practitioners (JP), Senior Practitioners (SP), Executives (EX), and Academics (ED) had on this aspect of the computing industry was of particular importance.
Workshop Activites
To have a workshop, you need things for the participants to do. So we began to plan out activities with the above mentioned goals in mind, but we also had to make sure they were cohesive to some key attributes of the workshop.
- 40-50 total Participants
- 7 Academics acting as Facilitators
- Two day workshop
- Both days’ workshops would last 1 hour 30 minutes
- Would be virtual and use Zoom to communicate
- Would utilize Miro for the activates and data generation
- Data could also be notes taken by facilitators during activity
From here, we set out to do 2 main things. First was to set-up the activities for the first day, which would be more constrained and in-depth to draw out themes to use for a more open ended second day. Second would be to develop a tutorial to help all the participants and facilitators use Miro during the workshop. Even though Miro is quite popular within our small UX bubble, most outside of it have never heard of it or used anything similar. Tis became very apparent after our first meeting with the facilitators, so we knew we had to ease our participants into this tool.
Day 1 Activities
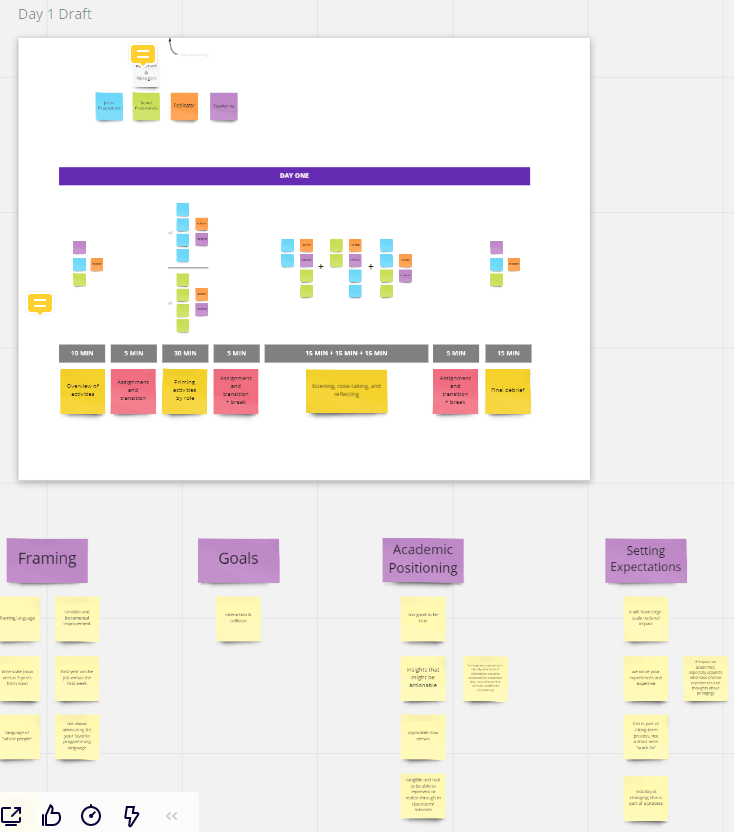
We started Day 1 by dividing up the day into 2 main activities, the first comprising of several homogenous breakout groups of JPs, SPs, EXs, and EDs. This would allow us to easily compare differences in the groups after the workshop. The second would also comprise of several breakout groups, this time heterogenous with a mix of all the different participants to see the collision of ideas in action.
To the left you can see our initial drafts for these day 1 activities, both activities divided into two separate parts. We would keep this initial format, but after ideation and meetings with the facilitators we changed a lot. Some specific things we added in across the activities was name cards at the top to signify who should be participating in what groups, and Kanbans full of the participants names (retitled the “blue talk box”) to ensure that everyone’s voice was heard.
Day 1, Activity 1: Getting to know your Peers
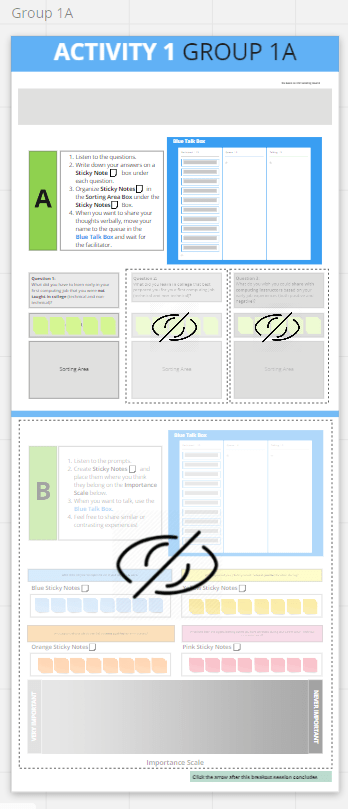
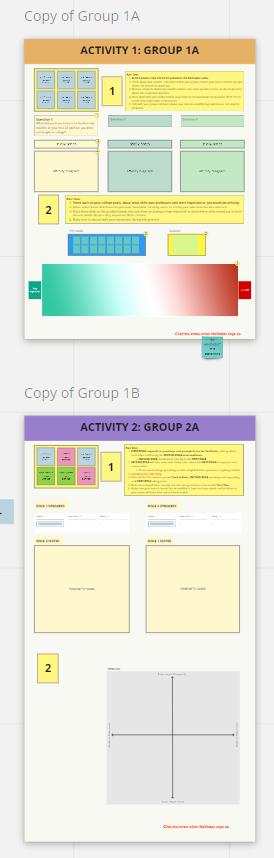
Part A: For this, we had participants answer 3 different questions, and generate their notes and insights from the prompts using the sticky notes below. These questions were tweaked for each group as they consisted of different members of the computing industry.
Part B: For this, the homogenous groups responded to some prompts and put their responses down in the sticky notes. After that, they placed them on the scale below, ranking the skill, topic, or challenge by how important they felt it was in the computing industry.
Day 1, Activity 2: Finding New Perspectives
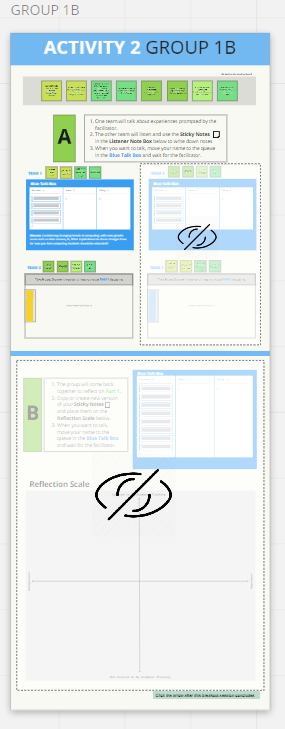
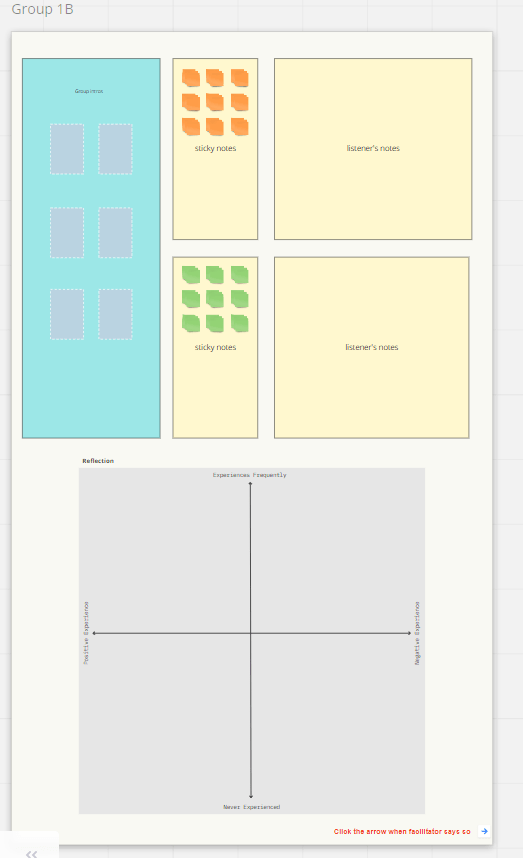
Part A: For the first part, the heterogenous groups were divided in two. The first half of the group had a conversation about a prompt asked by the facilitator for 15 minutes, with the other half taking notes and generating stickies. The halves then switched for another 15 minutes.
Part B: For this part, the sticky notes from part A would be copied down to a scale below, the X axis measuring importance and the Y axis measuring its coverage in academic training. From here the participants would discuss the topics shown in the sticky notes and then would be placed on the scale where they felt they belonged.
Day 1, Debrief:
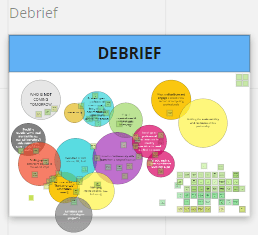
During the prior activities, Camile, Colin, and myself were observing and taking notes of main themes that came about in the discussions and conversations. We then used these to populate a debrief board in real-time. At the end of the activities, all the participants were brought into the same zoom room to discuss these themes and which ones we should focus on the following day.
Tutorial
A tutorial was very important because it had to address both the stakeholders of the facilitators and the participants, and as was made clear from early meetings if someone was confused by the tool they were suing, they would be completely distracted from the actual activities they are meant to use the tool for. With the, the onboarding/tutorial experience consisted of many different things:
- A Video tutorial for the Participants
- A Video tutorial for the Facilitators
- A list of preferred terms and best practices for the facilitators
- Would also include links and resources for any issues that might happen during the workshop
- A Landing frame at the start of the Workshop
- Would include a read tutorial, a play-around space, and a introduction to how the participants would navigate around the workshop miro board.
Video Tutorials
I created two separate tutorials, both using the official miro navigation tutorial as a base. The first was one created specifically for the facilitators and utilized the video format to explain how to successful move around the board that is hard to describe in words alone. It also included info on how to create, move, and edit sticky notes, including some facilitator specific things like moving between frames using a sidebar and mass copying sticky notes.
The participant tutorial was very similar to the facilitator one, but more stripped down because they participants did not need to do as much as the facilitators, and introducing tools they weren’t meant to use could confuse or overwhelm them. It was sent out to all 50+ Participants in the week before the workshop, as well as some additional info, and can be seen here.
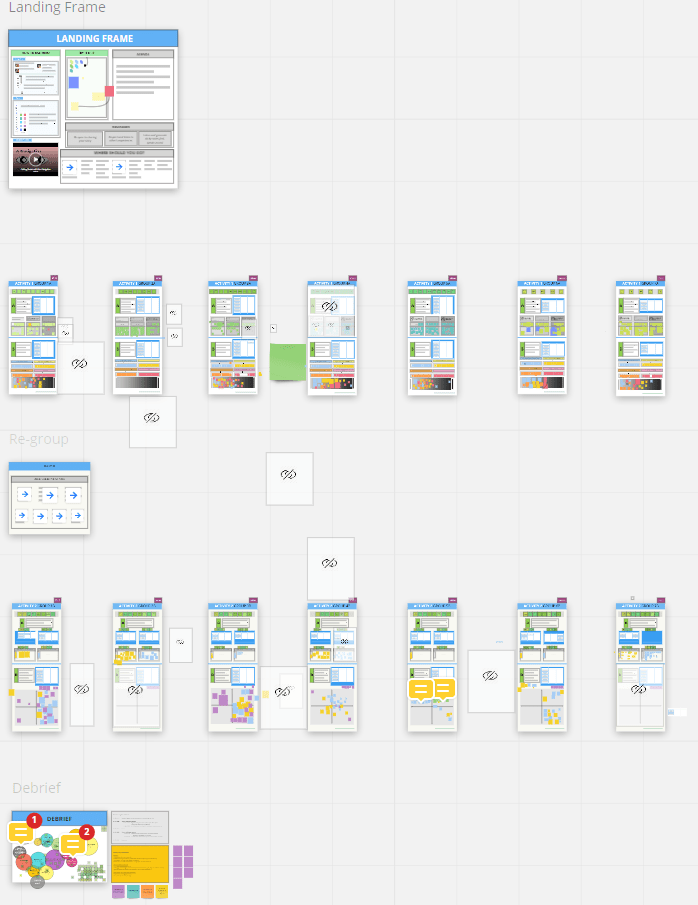
Landing Frame
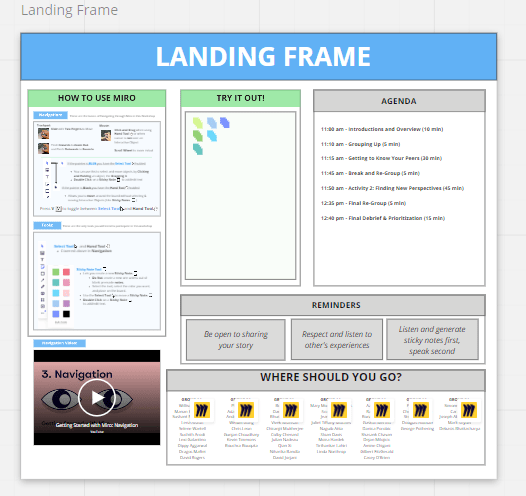
The landing frame consisted of a few main parts that allowed the participants to get comfortable with miro before diving straight into the activities.
- The How to use Miro section provided a written tutorial divided into two sections, one covering the basic navigation functionalities of miro in both touch pad and mouse configurations. The second covered the Tools the participants were expected to use during the workshop, which was limited only to the selection tool, hand tool, and sticky notes to keep things simple
- A series of icons were used to make the tutorial easy to follow through all the different tools and terms, which were kept consistent with miro’s own onboarding and tutorial resources.
- The Navigation Video gave participants a quick way to view a tutorial on how to navigate a miro board while the participants trickled in.
- The How-to-Miro are allowed participants to play around with the tools and sticky notes of miro so they could get comfortable before diving in.
- The Where should you go? both divided the participant’s into their groups and quickly introduced the method we would use to navigate the workshop, mainly using deeplinks.
Day 2 Activities
Between Day 1 and 2, we used the conversation and topics from the first day to create 7 themes to center discussion around for the second day. The second day was a lot more simple and focused more on open ended conversation than focused prompts and activities.
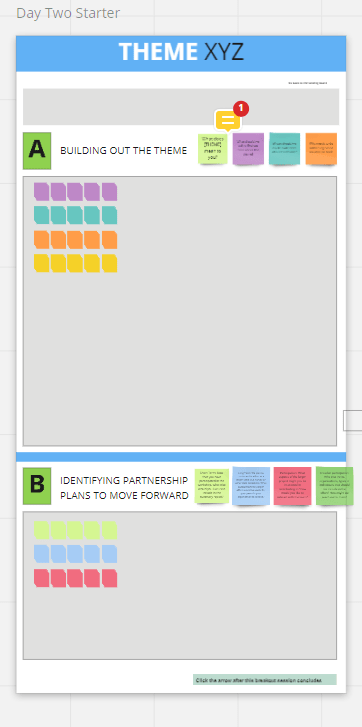
This was the main template of the miro frames for day 2. It followed the structure of day 1 closely, with the participants being broken up into groups to conversate, the total workshop being comprised of two activities, and those activities split into two parts. For the first half a group would discuss 1 of the 7 themes, responding to questions and generating sticky notes. At the halfway point, groups were re formed and participants were assigned to a different them than the first half.
This was a lot more open-ended than the first day, allowing participants to get deeper into these certain topics which generated more in-depth ideas and opinions on the computer industry and curriculum.
Analysis
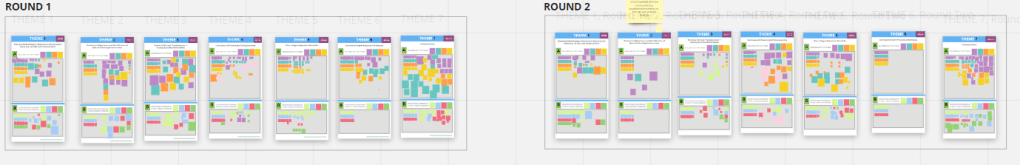
After these two days with over 50 participants, we had a lot and a lot of sticky notes, and needed a way to sort through them to send out a final report. The sheer amount of sticky notes was so great we had to get creative.
To start, we took data from day 2 and sorted the two rounds of discussion together, dividing by the questions the sticky notes were answering, letting us look deeper into the open ended discussions of day 2.
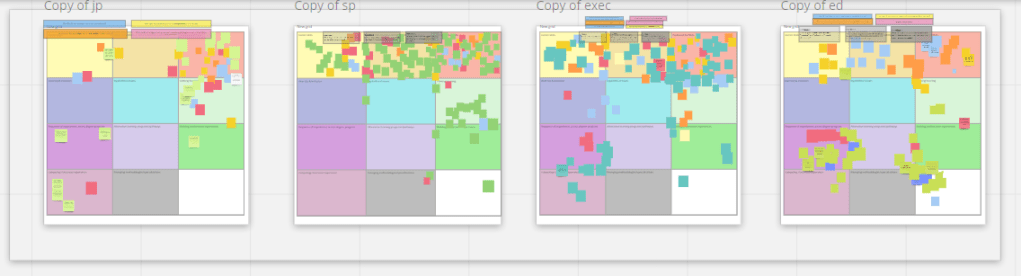
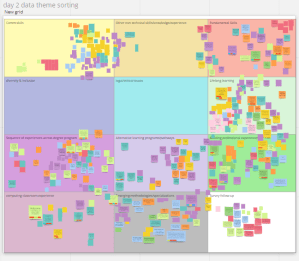
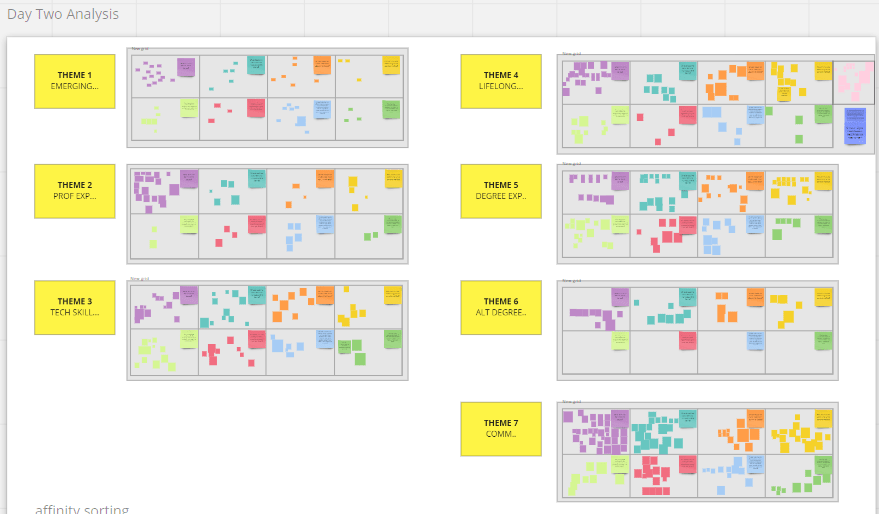
From, we took the day 1 sticky notes and separated them by their homogenous groups. Then we put those sticky notes into a grid of 11 themes, expanded from day 2’s list of themes, and affinity diagrammed them into those grids. We did the same with day 2 data as well.
From here, we were able to generate a final report with a bunch of raw data and some minor analysis of broad themes and trends we noticed from the workshop.
Next Steps
Now that we have the final report done and all the data gathered, we need to really dive in and analyze it further. This is going to take the form a research paper that will dive into what this data says about the current computing curriculum, where that curriculum is failing, and what we can do to help this. This is going to involve different professors from across the country, and will most likely get truly underway in January 2021.
